A
Absorption
Effort without price progress
Aggressive buying or selling that fails to move price meaningfully because the other side is supplying enough liquidity to stop the move. Absorption is one of our primary confirmations for a mean reversion trade.
Aggressive Buyers
Buyers crossing the ask
Participants using market orders to buy immediately at the available ask price, showing urgency to enter or add to long positions.
Aggressive Sellers
Sellers crossing the bid
Participants using market orders to sell immediately at the available bid price, showing urgency to enter or add to short positions.
Auction
The market's price-discovery process
The continuous interaction between buyers and sellers as the market tests prices and searches for an area where business can be conducted.
B
Balance
Relative agreement around value
A condition in which buyers and sellers are in relative agreement, often producing rotational trade around the Value Area and POC.
C
A widely followed inflation report measuring changes in prices paid by consumers for a basket of goods and services.
CVD
Cumulative Volume Delta
Cumulative Volume Delta is a running total of the difference between aggressive buying and aggressive selling throughout the session. We compare CVD to price to determine whether buyers or sellers are actually being rewarded for their effort.
D
Delta
Aggressive buying minus aggressive selling
The difference between volume traded at the ask and volume traded at the bid over a selected period or price area. We use Delta to identify where aggressive buyers or sellers became most active while building Decision Levels.
Delta Profile
Delta displayed by price
A profile showing where aggressive buyers or sellers were most active at each price within the selected session. It helps us see where buying or selling pressure was concentrated throughout the auction.
Demand Zone
Area of prior buying interest
A price area where buyers previously became active enough to stop a decline or initiate a move higher. Demand Zones become more meaningful when multiple market references align in the same area.
F
FOMC
Federal Open Market Committee
The Federal Reserve committee responsible for setting monetary policy, including its target range for short-term interest rates.
Follow-Through
Effort producing continued movement
Price continuing in the same direction as aggressive order flow, showing that the active side is being rewarded for its effort. Follow-through is one of our primary confirmations for a trend-following trade.
G
GDP
Gross Domestic Product
A broad measure of the total value of goods and services produced by an economy over a specific period.
H
The highest price traded during the current or referenced trading session.
J
JOLTS
Job Openings and Labor Turnover Survey
A labor-market report covering job openings, hires, quits, and separations across the U.S. economy.
L
Large Trades
Filtered institutional-sized market orders
Individual aggressive trades large enough to meet our chart filter, helping us focus on activity that may reflect institutional participation. Filtering out smaller trades helps us focus on the orders most likely to influence the auction.
The lowest price traded during the current or referenced trading session.
N
A major monthly employment report measuring the change in U.S. payroll employment outside the farming sector.
P
PCE
Personal Consumption Expenditures Price Index
An inflation measure based on consumer spending patterns and closely watched by the Federal Reserve.
PMI
Purchasing Managers’ Index
A survey-based measure of business activity in manufacturing or services; readings above 50 generally indicate expansion.
The price where the greatest amount of volume traded within the selected profile or session. In balanced auctions, the POC often acts as a magnet as price rotates around fair value.
An inflation report measuring changes in prices received by domestic producers for their goods and services.
S
Supply Zone
Area of prior selling interest
A price area where sellers previously became active enough to stop an advance or initiate a move lower. Supply Zones become more meaningful when multiple market references align in the same area.
V
The upper boundary of the Value Area, representing the highest price considered fair during the selected session. We often use VAH as an important reference for rotational and reversal trades.
The lower boundary of the Value Area, representing the lowest price considered fair during the selected session. We often use VAL as an important reference for rotational and reversal trades.
Value Area
Where most business was conducted
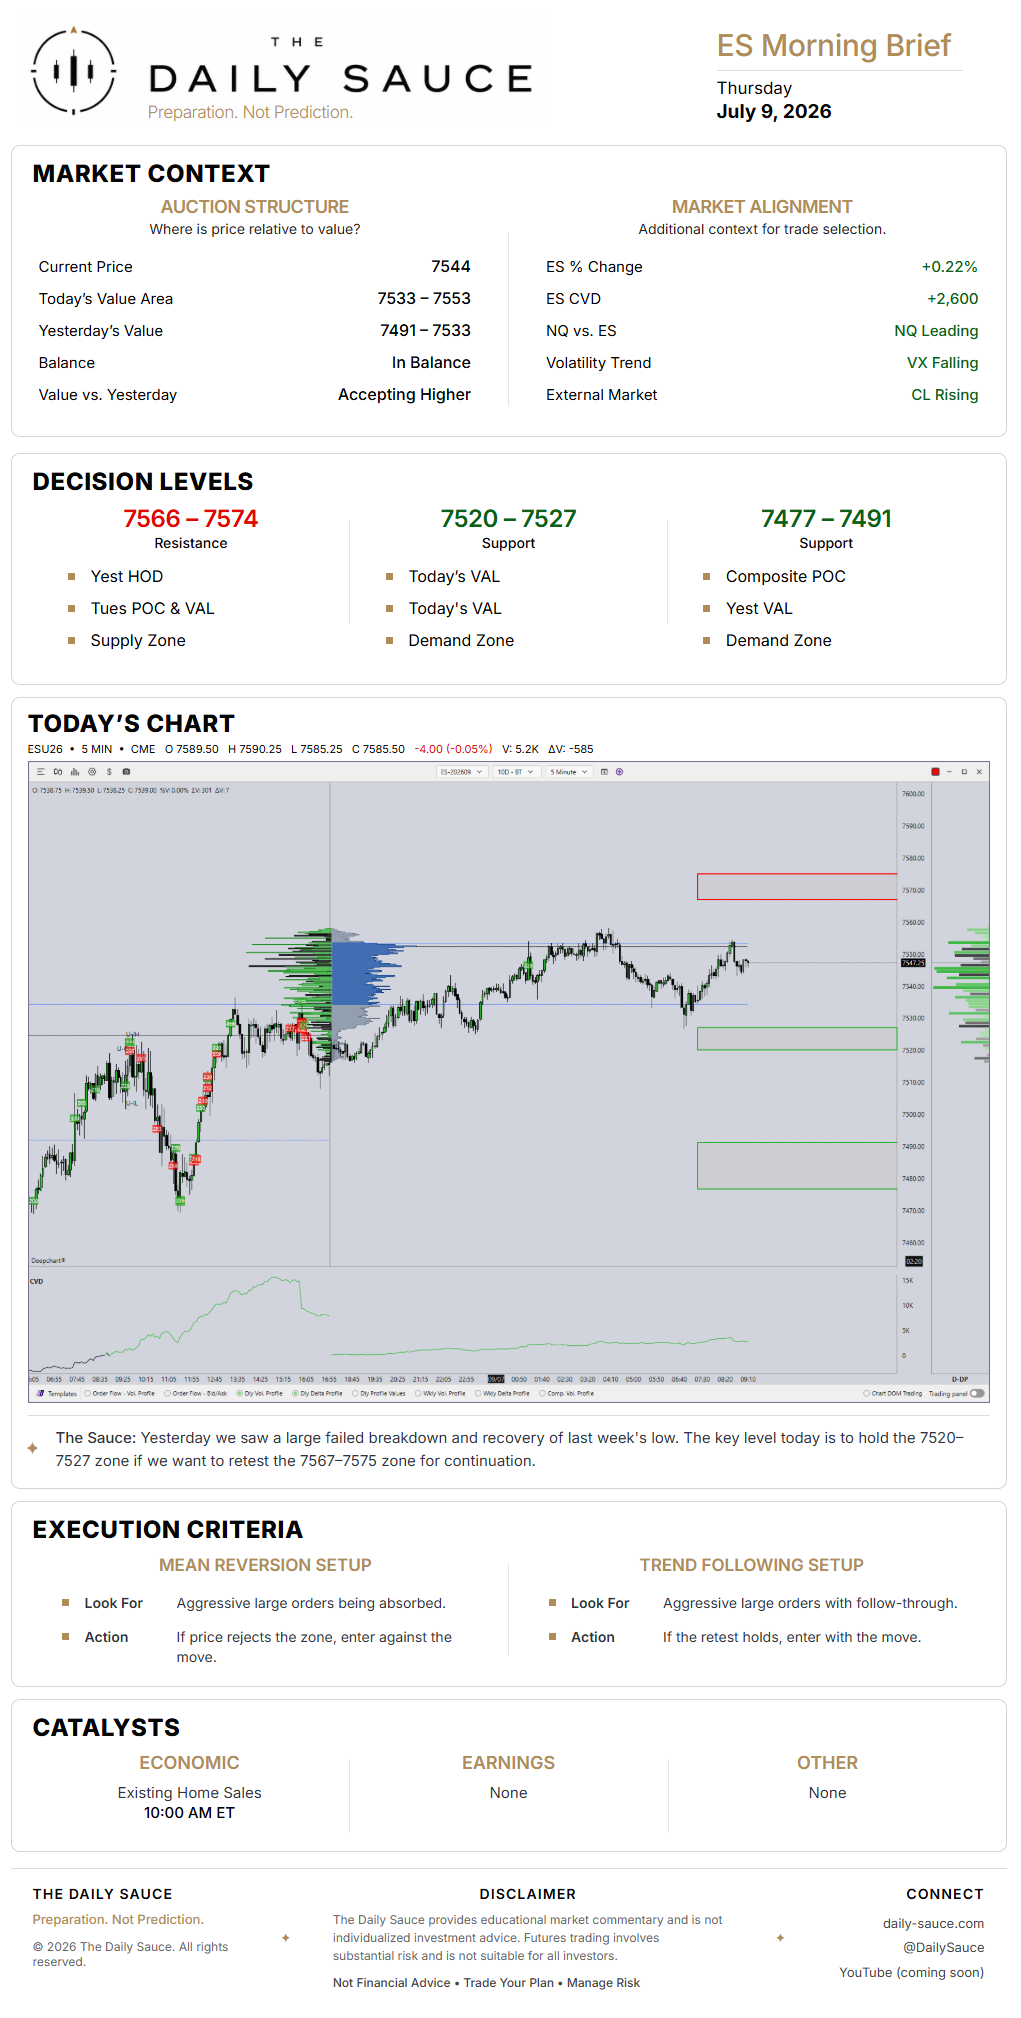
The price range containing approximately 70% of the selected session's volume, representing where the market considered price to be fair. We compare today's Value Area to previous sessions to determine whether the auction is balanced or accepting value at a new location.
Volume Profile
Volume displayed by price
A horizontal distribution showing how much volume traded at each price during the selected session or range. It provides the structural framework we use to identify value and build Decision Levels.